
Aviation Weather Services – Forecast Charts
Short-Range Surface Prognostic (Prog) Charts
Short-Range Surface Prognostic (Prog) Charts (Figure 8-1) provide a forecast of surface pressure systems, fronts and precipitation for a 2-day period. The forecast area covers the 48- contiguous states, the coastal waters and portions of adjacent countries. The forecasted conditions are divided into four forecast periods, 12-, 24-, 36-, and 48-hours. Each chart depicts a “snapshot” of weather elements expected at the specified valid time.
The Surface Prognostic (Prog) Charts are available at the Aviation Weather Services (ADDS) web site.
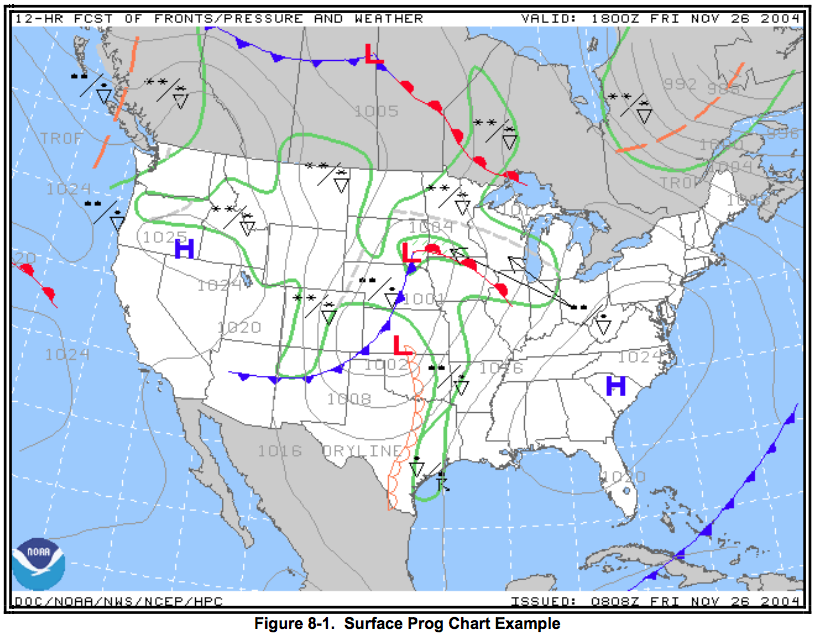
Precipitation areas are enclosed by thick, solid, green lines (Figure 8-4). Standard precipitation symbols are used to identify precipitation types (Figure 8-3). These symbols are positioned within or adjacent to the associated area of precipitation. If adjacent to the area, an arrow will point to the area with which they are associated. A mix of precipitation is indicated by the use of two pertinent symbols separated by a slash (Figure 8-4). A bold, dashed, grey line is used to separate precipitation within an outlined area with contrasting characteristics (Figure 8-4). For instance, a dashed line would be used to separate an area of snow from an area of rain.
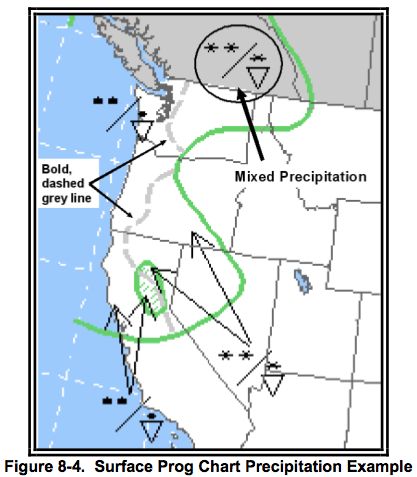
Precipitation characteristic are further described by the use of shading. Shading or lack of shading indicates the expected coverage of the precipitation. Shaded areas indicate the precipitation is expected to have more than 50% (broken) coverage. Unshaded areas indicate 30-50% (scattered) coverage.
Issuance
Short-Range Surface Prognostic (Prog) Charts are issued by the Hydrometeorological Prediction Center (HPC) in Camp Springs, MD. The 12- and 24-Hour Surface Prognostic (Prog). Charts are issued four times a day and are termed “Day 1” progs. The 36- and 48- Hour Surface Prog Charts are issued twice daily and are termed “Day 2” progs. They are available on the HPC web site.
Use
Short-Range Surface Prognostic (Prog) Charts can be used to obtain an overview of the progression of surface weather features during the next 48 hours. The progression of weather is the change in position, size, and intensity of weather with time. Progression analysis is accomplished by comparing charts of observed conditions to the 12-, 24-, 36-, and 48-hour progs. Short-Range Surface Prognostic (PROG) Charts make the comprehension of weather details easier and more meaningful.
Low-Level Significant Weather (SIGWX) Charts
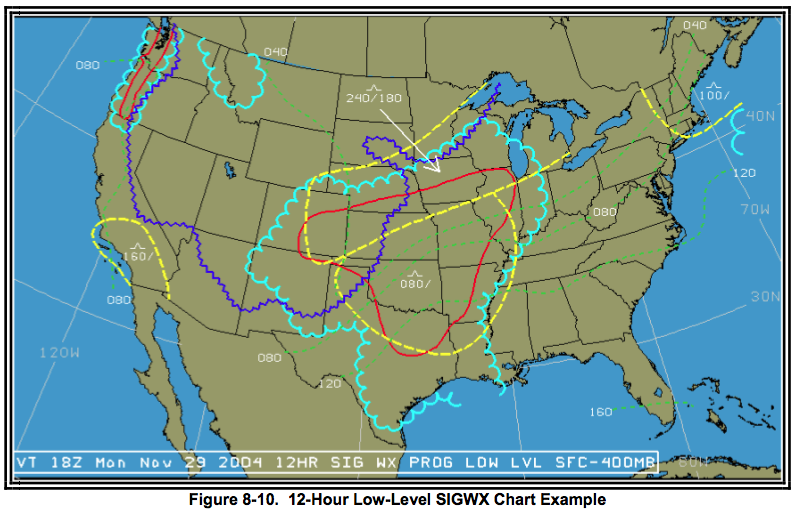
The Low-Level Significant Weather (SIGWX) Charts (Figure 8-10) provide a forecast of aviation weather hazards primarily intended to be used as guidance products for pre-flight briefings. The forecast domain covers the 48 contiguous states and the coastal waters for altitudes 24,000 ft MSL (Flight Level 240 or 400 millibars) and be expected at the specified valid time.
Flying Categories
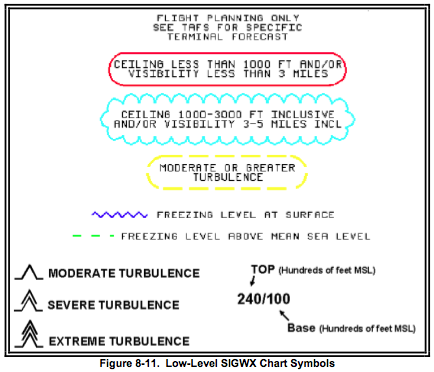
Instrument Flight Rules (IFR) areas are outlined with a solid red line, Marginal Visual Flight Rules (MVFR) areas are outlined with a scalloped blue line, Visual Flight Rules (VFR) areas are not depicted (Figure 8-12).
Turbulence
Areas of moderate or greater turbulence are enclosed by bold, dashed, yellow lines (Figure 8- 13). Turbulence intensities are identified by standard symbols (Figure 8-11). The vertical extent of turbulence layers is specified by top and base heights separated by a slant. The intensity symbols and height information may be located within or adjacent to the forecasted areas of turbulence. If located adjacent to an area, an arrow will point to the associated area. Turbulence height is depicted by two numbers separated by a solidus /. For example, an area on the chart with turbulence indicated as 240/100 indicates the turbulence can be expected from the top at FL240 to the base at 10,000 feet MSL. When the base height is omitted, the turbulence is forecast to reach the surface. For example, 080/ identifies a turbulence layer from the surface to 8,000 feet MSL. Turbulence associated with thunderstorms is not depicted on the chart.
Freezing Levels
The freezing level at the surface is depicted by a blue, saw-toothed symbol (Figure 8-11). The surface freezing level separates above-freezing from below-freezing temperatures at the Earth’s surface. Freezing levels above the surface are depicted by fine, green, dashed lines labeled in hundreds of feet MSL beginning at 4,000 feet using 4,000 foot intervals. If multiple freezing levels exist, these lines are drawn to the highest freezing level.
Issuance
Low-Level Significant Weather (SIGWX) Charts are issued four times per day by the Aviation Weather Center (AWC) in Kansas City, Missouri (Table 8-2). Two charts are issued; a 12-hour and a 24-hour prog. Both are available on the AWC web site.
Use
The Low-Level Significant Weather (SIGWX) Charts provide an overview of selected aviation weather hazards up to 24,000 feet MSL (FL240 or 400 millibars) at 12- and 24-hours into the future.
Mid-Level Significant Weather (SIGWX) Chart
The Mid-Level Significant Weather (SIGWX) Chart provides a forecast of
significant en route weather phenomena over a range of flight levels from 10,000 ft MSL to
FL450, and associated surface weather features. The chart depicts a “snapshot” of weather
expected at the specified valid time.
The Mid-Level Significant Weather (SIGWX) Chart is available on the Aviation Weather Center
web site.
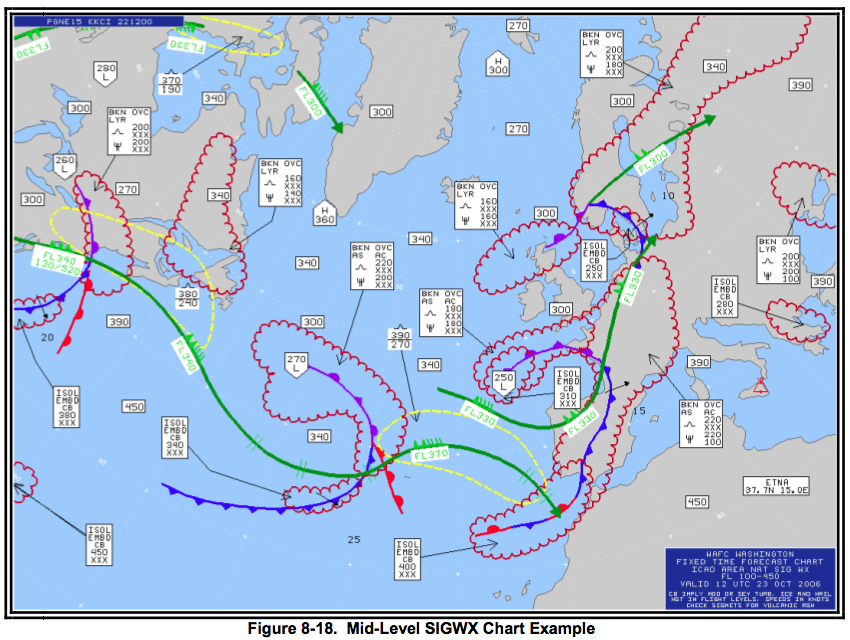
Thunderstorms
The abbreviation CB is only included where it refers to the expected occurrence of an area of
widespread cumulonimbus clouds, cumulonimbus along a line with little or no space between
individual clouds, cumulonimbus embedded in cloud layers, or cumulonimbus concealed by
haze. It does not referto isolated or scattered cumulonimbus not embedded in cloud layers or concealed by haze. Cumulonimbus clouds (CBs) are depicted by enclosed (red) scalloped lines. The identification and characterization of each cumulonimbus area appears within or adjacent to the outlined area. If the identification and characterization is adjacent to an outlined area, an arrow points to the appropriate cumulonimbus area.
Surface Frontal Positions and Movements
Surface fronts are depicted using the standard symbols found on the Surface Analysis Chart.
(Figure 8-2). An arrow identifies the direction of frontal movement with the speed indicated in
knots plotted near the arrow head (Figure 8-20).
Jet Streams
A jet stream axis with a wind speed of more than 80 knots is identified by a bold green line (Figure 8-21). An arrowhead is used to indicate wind direction. Double-hatched, light green lines positioned along a jet stream axis identify 20 knot wind speed changes.
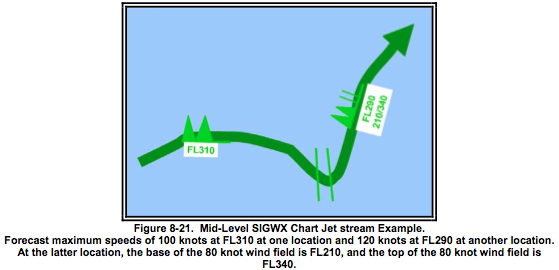
Symbols and altitudes are used to further characterize a jet stream axis. A standard wind symbol (light green) is placed at each pertinent position to identify wind velocity. The flight level “FL” in hundreds of feet MSL is placed adjacent to each wind symbol to identify the altitude of the jet stream axis.
Jet stream vertical depth (jet depth) forecasts are included when the maximum speed is 120 knots or more. Jet depth is defined as the vertical depths to the 80 knot wind field above and below the jet stream axis using flight levels.
Tropopause Heights
Tropopause heights are plotted at selected locations on the chart (Figure 8-22). They are enclosed by rectangles and plotted in hundreds of feet MSL. Centers of high (H) and low (L) tropopause heights are enclosed by polygons and plotted in hundreds of feet MSL.
Tropical Cyclones
Tropical cyclones are depicted by the appropriate symbol (Figure 8-23) with the storm’s name positioned adjacent to the symbol. Cumulonimbus clouds meeting chart criteria are identified and characterized relative to each storm.
Moderate or Severe Icing
Areas of moderate or severe icing are depicted by enclosed (red) scalloped lines (Figure 8-24). The identification and characterization of each area appears within or adjacent to the outlined area. If the identification and characterization is adjacent to an outlined area, an arrow points to the appropriate area.
Moderate or Severe Turbulence (in cloud or in clear air)
Forecast areas of moderate or severe turbulence associated with wind shear zones and/or mountain waves are enclosed by bold yellow dashed lines. Intensities are identified by standard symbols (Appendix J). The vertical extent of a turbulence layer is specified by top and base heights, separated by a horizontal line. A turbulence base which extends below the layer of the chart is identified with XXX. Thunderstorm turbulence is not identified.
Cloud Coverage (non-cumulonimbus)
Clouds are enclosed within (red) scalloped lines. Cloud coverage (non-cumulonimbus) appears within or adjacent to the outlined area.
Volcanic Eruptions
Volcanic eruption sites are identified by a trapezoidal symbol. The dot on the base of the trapezoid identifies the location of the volcano. The name of the volcano, as well as the latitude and longitude are noted adjacent to the symbol.
Volcanic Eruptions
Volcanic eruption sites are identified by a trapezoidal symbol. The dot on the base of the trapezoid identifies the location of the volcano. The name of the volcano, as well as the latitude and longitude are noted adjacent to the symbol.
Use
The Mid-Level Significant Weather (SIGWX) Chart is used to determine an overview of selected flying weather conditions between 10,000 feet MSL and FL450. It can be used by airline dispatchers for flight planning and weather briefings before departure and by flight crew members during flight.
High-Level Significant Weather (SIGWX) Charts
High-Level Significant Weather (SIGWX) Charts (Figure 8-30) provide a forecast of significant en route weather phenomena over a range of flight levels from FL250 to FL630, and associated surface weather features. Each chart depicts a “snap-shot” of weather expected at the specified valid time. They are available on the Aviation Weather Center (AWC) web site.
[These charts include the same items as the Mid-Level Significant Weather charts an in addition include Severe Squall Lines and Widespread Sandstorms.]
Severe Squall Lines
Severe squall lines are lines of CBs with 5/8 coverage or greater. They are identified by long dashed (white) lines with each dash separated by a V (Figure 8-37).Cumulonimbus clouds meeting chart criteria are identified and characterized with each squall line.
Widespread Sandstorms and Dust storms
Widespread sandstorms and dust storms are labeled with the appropriate symbol (Appendix I). The vertical extent of sand or dust is specified by top and base heights, separated by a horizontal line. Sand or dust which extends below the lower limit of the chart (FL240) is identified with XXX.
Issuance
In accordance with the World Meteorological Organization (WMO) and the World Area Forecast System (WAFS) of the International Civil Aviation Organization (ICAO), High-Level significant weather (SIGWX) forecasts are provided for the en-route portion of international flights. [They are issued four times each day and are not ammended.]
Use
High-Level Significant Weather (SIGWX) Charts are provided for the en route portion of international flights. These products are used directly by airline dispatchers for flight planning and weather briefings before departure and by flight crew members during flight.