Things to Remember IFR Checkride—Takeoff and Landing
§91.103 Preflight action.
Each pilot in command shall, before beginning a flight, become familiar with all available information concerning that flight. This information must include—
(b) For any flight, runway lengths at airports of intended use, and the following takeoff and landing distance information:
(1) For civil aircraft for which an approved Airplane or Rotorcraft Flight Manual containing takeoff and landing distance data is required, the takeoff and landing distance data contained therein; and
Density Altitude
In order to calculate takeoff and landing distances you need to know the density altitude of the airport. At high-altitude airports, and many airports on hot days, the ATIS will tell you the density altitude. You can also use your E6B to calculate it. Or you can just do the math as explained in an article in Flying.
density altitude = pressure altitude + [120 x (OAT – ISA Temp)]
where
pressure altitude = (standard pressure – your current pressure setting) x 1,000 + field elevation
Right now the altimeter setting at KSBP is 29.95 so the pressure altitude is:
(29.92 – 29.95) * 1000) + 212 = -300 + 212 = -88′
Temperature decreases by 2°C per thousand feet so to find ISA standard temperature for a given altitude, double the altitude and subtract that number from the starting standard temperature of 15°C.
Standard temperature at 212′ is 15 – .212 * 2 = 14.6
Temperature is currently 25.6°C so our formula is:
density altitude = -88 + [120 * (25.6 – 14.6)] = -88 + 1320 = 1,232
Let’s do Paso Robles where the temperature is 34.4, altimeter is 29.94, and the elevation is 838′
pressure altitude = (29.92 – 29.94) * 1000 + 838 = .02 * 1000 + 838 = 858′
ISA Temp = 15 – .838 * 2 = -13.3°C
density altitude = 858 + [120 * (34.4 – 13.3)] = 3,370′
That’s starting to get to the point where the takeoff roll is noticeably longer.
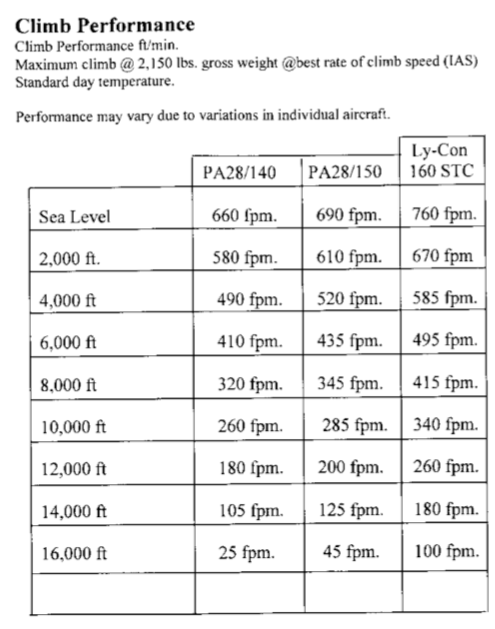
According to the LyCon STC for the Cherokee, the 160 HP engine will have approx. 2.2% speed and range increase over the standard model. Take off, stall speeds, landing distances and maximum glide data can be used directly from the Piper Cherokee Manual.
Climb rate will be better than the stock engine.