
AC 00-6B Aviation Weather: Part 1
Weather is not a capricious act of nature, but rather the atmosphere’s response to unequal rates of radiational heating and cooling across the surface of the Earth and within its atmosphere.
Troposphere.
The troposphere begins at the Earth’s surface and extends up to about 11 kilometers (36,000 feet) high.
The vertical depth of the troposphere varies due to temperature variations which are closely associated with latitude and season. It decreases from the Equator to the poles, and is higher during summer than in winter. At the Equator, it is around 18-20 kilometers (11-12 miles) high, at 50° N and 50° S latitude, 9 kilometers (5.6 miles), and at the poles, 6 kilometers (3.7 miles) high. Knowledge tests asks in feet: Average: 37,000′, poles: 25,000-30,000′, mid-latitudes: 25,000′, equator: 55,000-65,000′.
Tropopause
The transition boundary between the troposphere and the stratosphere.
Stratosphere
The stratosphere extends from the tropopause up to 50 kilometers (31 miles) above the Earth’s surface. This layer holds 19 percent of the atmosphere’s gases, but very little water vapor.
Temperature increases with height as radiation is increasingly absorbed by oxygen molecules, leading to the formation of ozone. The temperature rises from an average -56.6 °C (-70 °F) at the tropopause to a maximum of about -3 °C (27 °F) at the stratopause due to this absorption of ultraviolet radiation. The increasing temperature also makes it a calm layer, with movements of the gases being slow.
Mesosphere
The mesosphere extends from the stratopause to about 85 kilometers (53 miles) above the Earth. On average, temperature decreases from about -3 °C (27 °F) to as low as -100 °C (-148 °F) at the mesopause.
Thermosphere.
The thermosphere extends from the mesopause to 690 kilometers (430 miles) above the Earth. This layer is known as the upper atmosphere.
Thermopause
The transition boundary that separates the exosphere from the thermosphere.
Exosphere
The exosphere is the outermost layer of the atmosphere, and extends from the thermopause to 10,000 kilometers (6,200 miles) above the Earth.
Standard Atmosphere
1013.25 Hectopascals
15°C
29.92 Inches of Mercury
59°F
Lapse rate 2°C per 1,000′
Thermal Response
Water has the highest specific heat capacity of any naturally occurring substance. That means it has a much higher capacity for storing heat energy than other substances, such as soil, sand, rock, or air. Water can store large amounts of heat energy while only experiencing a small temperature change. A body of water exhibits greater resistance to temperature change, called thermal inertia, than does a land mass.
Water temperature changes occur to depths of six meters (20 feet) or more on a daily basis, and 200 to 600 meters (650 to 1950 feet) annually. Over land heat must be transferred via the slow process of conduction. Land temperature changes occur to depths of only 10 centimeters (4 inches) on a daily basis and 15 meters (50 feet) or less annually.
Temperature Inversion
A surface-based inversion typically develops over land on clear nights when wind is light. The ground radiates and cools much faster than the overlying air. Air in contact with the ground becomes cool, while the temperature a few hundred feet above changes very little. Thus, temperature increases with height.
An inversion may also occur at any altitude when conditions are favorable. For example, a current of warm air aloft overrunning cold air near the surface produces an inversion aloft. Inversions are common in the stratosphere.
The principal characteristic of an inversion layer is its marked stability, so that very little turbulence can occur within it.
Temperature-Dewpoint Spread (Dewpoint Depression)
Surface temperature-dewpoint spread is important in anticipating fog, but has little bearing on precipitation. To support precipitation, air must be saturated through thick layers aloft.
Sensible Heating
Sensible heating involves both conduction and convection. It occurs due to differences in air density. Warm air is less dense than cool air. Because air is a poor conductor of heat, convection is much more important than conduction as a heat transport mechanism within the atmosphere.
Latent Heat
The phase transition of water and associated latent heat exchanges are largely responsible for transferring the excess heat from the surface of the Earth into its atmosphere. As the Earth’s surface absorbs radiation, some of the heat produced is used to evaporate (vaporize) water from oceans, lakes, rivers, soil, and vegetation. The water absorbs heat energy due to the latent heat of vaporization. Some of this water vapor condenses to microscopic water droplets or deposits as ice crystals that are visible as clouds. During cloud formation, the water vapor changes state, and latent heat is released into the atmosphere. During this process, the excess heat is transferred from the Earth’s surface into its atmosphere.
Heat Imbalance Variations with Latitude
About 35° latitude in both hemispheres is where incoming and outgoing radiation is equal. The excess heat in the tropics must be transported polar by some mechanism(s). This poleward heat transport is accomplished by atmospheric circulations, weather, and ocean currents.
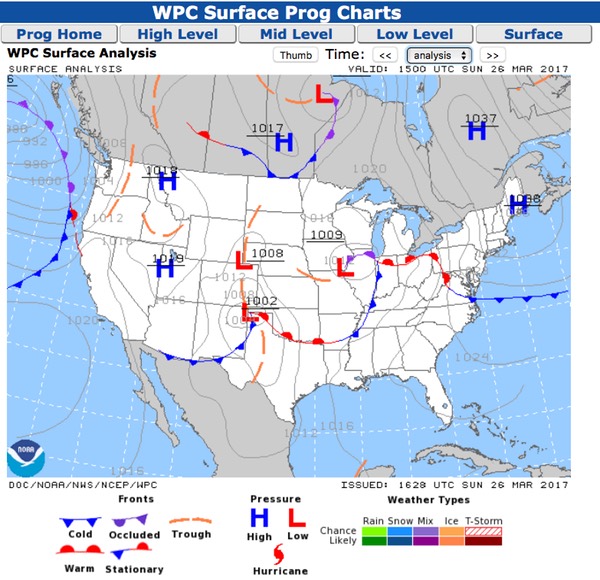
Sea Level Pressure
Since pressure varies greatly with altitude, we cannot readily compare station pressures between stations at different altitudes. To make them comparable, we adjust them to some common level. Mean sea level (MSL) is the most useful common reference.
Sea Level Pressure Analyses (Surface Chart)
After plotting sea level pressure on a surface chart, lines are drawn connecting points of equal sea level pressure. These lines of equal pressure are isobars. Hence, the surface chart is an isobaric analysis showing identifiable, organized pressure patterns. Four pressure systems are commonly identified: low, high, trough and ridge.
Low: A minimum of atmospheric pressure in two dimensions (closed isobars) on a surface chart, or a minimum of height (closed contours) on a constant pressure chart. Also known as a cyclone.
High: A maximum of atmospheric pressure in two dimensions (closed isobars) on a surface chart, or a maximum of height (closed contours) on a constant pressure chart. Also known as an anticyclone.
Trough: An elongated area of relatively low atmospheric pressure.
Ridge: An elongated area of relatively high atmospheric pressure.
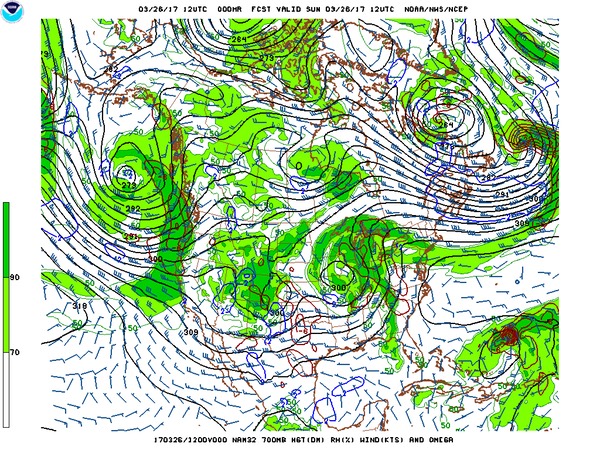
Constant Pressure Surface Analysis (Upper Air Chart)
These heights measured by the rawinsonde (and other types of instruments) are plotted on a constant pressure chart and analyzed by drawing a line connecting points of equal height. These lines are called height contours.
These charts can be found at the Standard Briefing page for various pressures. Here’s the one for 700MB ~10,000′.
Density
Density is directly related to pressure. Assuming constant mass and temperature, an air parcel with a higher pressure is denser than an air parcel with a lower pressure.
Density is inversely related to temperature. Assuming constant mass and pressure, an air parcel with a higher temperature is less dense than an air parcel with a lower temperature. In the atmosphere, temperature has the most effect on density in the horizontal direction; that is, with horizontal changes of location.
Density of an air parcel is inversely related to its quantity of water vapor. Assuming constant pressure, temperature, and volume, air with a greater amount of water vapor is less dense than air with a lesser amount of water vapor. This is because dry air molecules have a larger mass (weight) than water vapor molecules, and density is directly related to mass.
Altitude
True Altitude
Since existing conditions in a real atmosphere are seldom standard, altitude indications on the altimeter are seldom actual or true altitudes. True altitude is the actual vertical distance above MSL.
Indicated Altitude
Indicated altitude is the altitude above MSL indicated on the altimeter when set at the local altimeter setting.
Altimeter Setting
Since the altitude scale is adjustable, a pilot can set the altimeter to read true altitude at some specified height. Takeoff and landing are the most critical phases of flight; therefore, airport elevation is the most desirable altitude for a true reading of the altimeter. The altimeter setting is the value to which the scale of the pressure altimeter is set so the altimeter indicates true altitude at field elevation.
Corrected (Approximately True) Altitude.
If a pilot could always determine mean temperature of a column of air between the aircraft and the surface, flight computers would be designed to use this mean temperature in computing true altitude. However, the only guide a pilot has to temperature below him is free air temperature at his altitude. Therefore, the flight computer uses outside air temperature to correct indicated altitude to approximate true altitude. The corrected (approximately true) altitude is indicated altitude corrected for the temperature of the air column below the aircraft, the correction being based on the estimated deviation of the existing temperature from standard atmosphere temperature. It is a close approximation to true altitude and is labeled true altitude on flight computers. It is close enough to true altitude to be used for terrain clearance, provided the pilot has his altimeter set to the value reported from a nearby reporting station.
Pressure Altitude
In the standard atmosphere, sea level pressure is 29.92 inches of mercury (1013.2 millibars). Pressure decreases at a fixed rate upward through the standard atmosphere. Therefore, in the standard atmosphere, a given pressure exists at any specified altitude. Pressure altitude is the altitude (above MSL) shown by the altimeter when set to 29.92 inches of mercury.
Density Altitude
Density altitude is the pressure altitude corrected for temperature deviations from the standard atmosphere. Density altitude bears the same relation to pressure altitude as true altitude does to indicated altitude.
Density altitude equals field elevation during standard atmospheric conditions, but conditions are rarely standard. Density altitude is higher (lower) than standard at airports that report lower (higher) than standard pressures (29.92 inches of mercury) and/or higher (lower) than standard temperatures. Temperature is the most important factor since temperature has the greatest effect on density horizontally in the atmosphere.
Density altitude and aircraft performance.
Higher (lower) density altitude decreases (increases) performance. High density altitude is a hazard since it reduces aircraft performance in the following three ways:
1. It reduces power because the engine takes in less air to support combustion.
2. It reduces thrust because there is less air for the propeller to work with, or a jet has less mass of gases to force out of the exhaust.
3. It reduces lift because the light air exerts less force on the airfoils.
The aircraft lifts off, climbs, cruises, glides, and lands at the prescribed indicated airspeeds; but at a specified indicated airspeed, the pilot’s true airspeed and groundspeed increase proportionally as density altitude becomes higher.
The net results are that high density altitude lengthens a pilot’s takeoff, and landing rolls and reduces his or her rate of climb. Before lift-off, the plane must attain a faster groundspeed, and, therefore, needs more runway; and the reduced power and thrust add a need for still more runway. The plane lands at a faster groundspeed and, therefore, needs more room to stop. At a prescribed indicated airspeed, it is flying at a faster true airspeed, and, therefore, covers more distance in a given time, which means climbing at a shallower angle. Adding to this are the problems of reduced power and rate of climb.
Forces That Affect the Wind
Three primary forces affect the flow of wind: Pressure Gradient Force (PGF), Coriolis force, and friction.
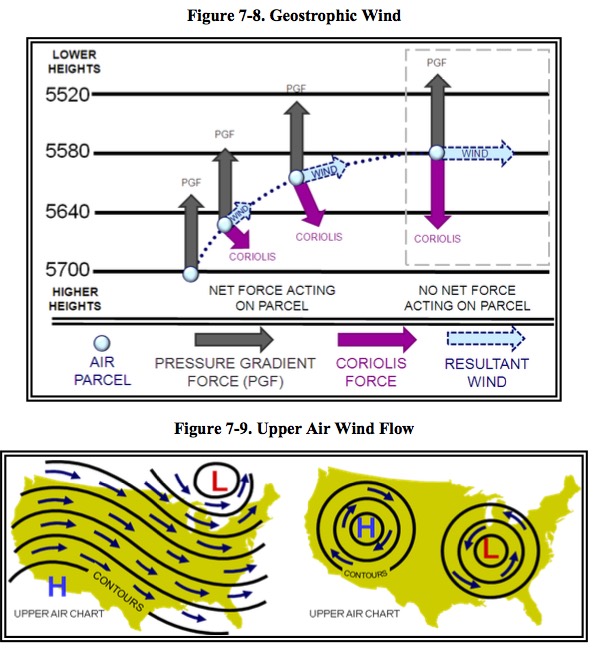
Pressure Gradient Force (PGF)
Wind is driven by pressure differences which create a force called the Pressure Gradient Force (PGF). Whenever a pressure difference develops over an area, the PGF makes the wind blow in an attempt to equalize pressure differences. This force is identified by height contour gradients on constant pressure charts and by isobar gradients on surface charts.
The wind would flow from high to low pressure if the PGF was the only force acting on it. However, because of the Earth’s rotation, there is a second force called the Coriolis force that affects the direction of wind flow.
Coriolis Force
A moving mass travels in a straight line until acted on by some outside force. However, if one views the moving mass from a rotating platform, the path of the moving mass relative to his platform appears to be deflected or curved.
The force deflects air to the right in the Northern Hemisphere and to the left in the Southern Hemisphere. Coriolis force is at a right angle to wind direction and directly proportional to wind speed; that is, as wind speed increases, Coriolis force increases. At a given latitude, double the wind speed and you double the Coriolis force.
Coriolis force varies with latitude from zero at the Equator to a maximum at the poles. It influences wind direction everywhere except immediately at the Equator, but the effects are more pronounced in middle and high latitudes. At a given latitude, double the wind speed and you double the Coriolis force.
Friction Force
Friction between the wind and the terrain surface slows the wind. The rougher the terrain, the greater the frictional effect. Also, the stronger the wind speed, the greater the friction.
Upper Air Wind
In the atmosphere above the friction layer (lowest few thousand feet), only PGF and Coriolis force affect the horizontal motion of air. Remember that the PGF drives the wind and is oriented perpendicular to height contours. When a PGF is first established, wind begins to blow from higher to lower heights directly across the contours. However, the instant air begins moving, Coriolis force deflects it to the right. Soon the wind is deflected a full 90° and is parallel to the contours. At this time, Coriolis force exactly balances PGF. With the forces in balance, wind will remain parallel to contours. This is called the geostrophic wind.
Surface Wind
At the surface of the Earth, all three forces come into play. As frictional force slows the wind speed, Coriolis force decreases. However, friction does not affect PGF. PGF and Coriolis force are no longer in balance. The stronger PGF turns the wind at an angle across the isobars toward lower pressure until the three forces balance
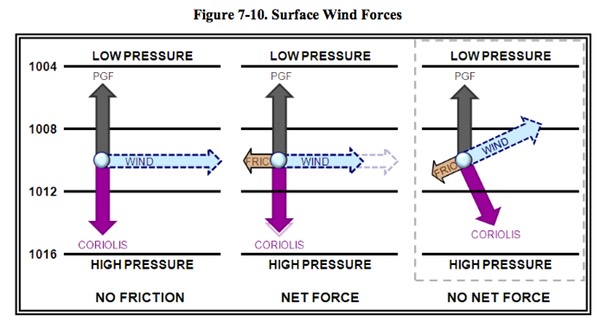
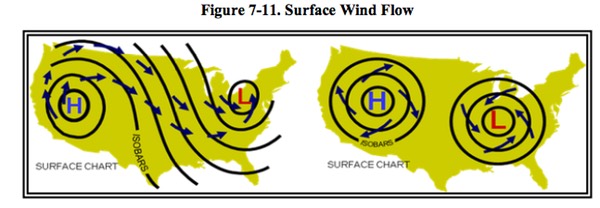
The angle of surface wind to isobars is about 10° over water, increasing to as high as 45° over rugged terrain. The end result is, in the Northern Hemisphere, the surface wind spirals clockwise and outward from high pressure, and counterclockwise and inward into low pressure (see Figure 7-11). In mountainous regions, one often has difficulty relating surface wind to pressure gradient because of immense friction, and also because of local terrain effects on pressure.
Jet Streams
Jet streams are relatively narrow bands of strong wind in the upper levels of the atmosphere. The winds blow from west to east in jet streams, but the flow often meanders southward and northward in waves. Jet streams follow the boundaries between hot and cold air. Since these hot and cold air boundaries are most pronounced in winter, jet streams are the strongest for both the Northern and Southern Hemisphere winters.
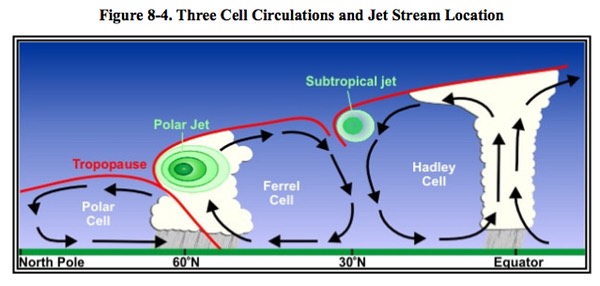
The momentum of air as it travels around the Earth is conserved, which means as the air that is over the Equator starts moving toward one of the poles, it keeps its eastward motion constant. The Earth below the air, however, moves slower, as that air travels toward the poles. The result is that the air moves faster and faster in an easterly direction (relative to the Earth’s surface below) the farther it moves from the Equator.
In addition, with the three cell circulations mentioned previously, the regions around 30° N/S and 50°-60° N/S are areas where temperature changes are the greatest. As the difference in temperature between the two locations increases, the strength of the wind increases. Therefore, the regions around 30° N/S and 50°-60° N/S are also regions where the wind in the upper atmosphere is the strongest.
The jet stream is often indicated by a line on maps, and shown by television meteorologists. The line generally points to the location of the strongest wind. In reality, jet streams are typically much wider. They are less a distinct location, and more a region where winds increase toward a core of highest speed.
Local Winds
Local winds are small-scale wind field systems driven by diurnal heating or cooling of the ground. Air temperature differences develop over adjacent surfaces. Air in contact with the ground heats during the day and cools at night. Low-level pressure gradients develop with higher pressure over the cooler, denser air, and lower pressure over the warmer, less dense air.
Low-level winds develop in the direction of the Pressure Gradient Force (PGF). Coriolis force is insignificant because the circulation’s dimension (less than 100 miles) and life span (less than 12 hours) are too short for significant Coriolis deflection. Thus, the wind generally blows from a high-pressure cool surface to a low-pressure warm surface.